

Key Takeaways
- Ad revenue in mobile gaming is generated through CPM, CPC, and CPA models delivered via rewarded video, interstitial, banner, and playable ad formats.
- Rewarded video ads generate the highest eCPMs in mobile advertising ($8 to $20 in tier-1 markets) and improve retention by up to 3.5x compared to players who do not engage with rewarded formats.
- Fill rate, the percentage of ad requests successfully filled with an ad, directly determines how much of your potential ad inventory converts to revenue. Low fill rates are fixed through mediation, not by switching ad networks.
- Ad mediation platforms like AppLovin MAX, IronSource, and Google AdMob Mediation increase fill rates and eCPM by running real-time auctions across multiple demand sources simultaneously.
- ARPDAU (Average Revenue Per Daily Active User) is the primary metric for ad revenue optimization. Every ad frequency and format decision should be evaluated against its ARPDAU impact, not raw impression volume.
- US iOS rewarded video eCPM reached $19.63 in Q4 2024. Global averages range from $3.31 to $19.63, depending on geography, making regional ad strategy essential for maximizing global ad revenue in mobile gaming.
- Over-ad-serving destroys ARPDAU by reducing the retention that generates ad impressions. The optimal ad frequency is the maximum amount players tolerate before churn increases.
Introduction
For free-to-play mobile games, ad revenue in mobile gaming is the economic engine that funds development, sustains live operations, and pays the teams that keep games alive. Understanding how ad revenue works at a technical and strategic level is no longer optional for any studio building a competitive title in 2026.
The global mobile advertising market reached projected spending of $400 billion in 2024. Within that, mobile gaming commands premium CPMs because gamers are a highly engaged, high-intent audience segment that advertisers pay premium rates to reach. US iOS gaming apps generate rewarded video eCPMs of $11 to $20. When optimized correctly, ad revenue in mobile gaming becomes the primary revenue stream for hyper-casual and casual games, and a significant secondary stream for mid-core titles running hybrid monetization models.
This guide explains every component of mobile game ad revenue in depth: the pricing models (CPM, CPC, CPA), the ad formats (rewarded video, interstitial, banner, playable), fill rate mechanics, mediation strategy, platform selection, and the optimization practices that separate studios earning $0.05 ARPDAU from those earning $0.15 ARPDAU from the same player base size.
How Mobile Game Ad Revenue Works
Ad revenue in mobile gaming operates through a technology chain. The game integrates an ad SDK from a network or mediation platform. When a player reaches an ad trigger point (between levels, on death, on menu transition), the game sends an ad request to the SDK. The SDK runs a real-time auction where advertisers bid to display their content. The highest-bidding advertiser wins, the ad is served, and the publisher (the game developer) earns a share of the ad spend.
Revenue is calculated based on the pricing model of the winning campaign. CPM (Cost Per Mille) pays per 1,000 impressions served. CPC (Cost Per Click) pays when a user clicks the ad. CPA (Cost Per Action) pays when a user completes a specific post-click action such as app installation, account registration, or in-app purchase. Different pricing models optimize for different advertiser goals and generate different revenue efficiency for publishers.
The effective metric publishers use to measure all ad revenue regardless of pricing model is eCPM (Effective Cost Per Mille), calculated as total ad revenue divided by total impressions, multiplied by 1,000. eCPM is the single number that allows fair comparison of ad performance across formats, networks, and time periods.
Understanding CPM, CPC, and CPA
CPM: Cost Per Mille
CPM is the most common pricing model in mobile game advertising. The publisher earns revenue for every 1,000 ad impressions served, regardless of whether users click or take action. From a publisher's perspective, CPM is straightforward: more impressions equal more revenue.
CPM benchmarks in 2026: US iOS rewarded video eCPM reaches $11 to $20. US Android rewarded video eCPM is $8 to $16. European markets average $6 to $14. Asia-Pacific markets average $3 to $8. Latin American and Southeast Asian markets average $1 to $5. This geographic variance is why regional ad strategy matters: maximizing ad revenue in mobile gaming globally requires different monetization configurations for US/Canada/UK audiences versus LATAM or Southeast Asia audiences.
CPM rates peak in Q4 (October through December) due to holiday advertiser spend. Developers who schedule major content updates and UA campaigns around Q4 peak eCPMs can generate 20 to 40% higher ad revenue per impression during this period than in Q1.
CPC: Cost Per Click
CPC pays when a user clicks an ad. For publishers, CPC is less predictable than CPM because revenue depends on both ad quality (which drives user interest in clicking) and targeting accuracy (which determines how relevant the ad is to the viewer). Banner ads and some display placements frequently operate on CPC models.
Optimizing for CPC revenue requires strong ad placement design: ads placed in high-attention positions within the game UI generate more clicks than ads placed in peripheral or obscured positions. However, placement design must balance click-through rate against user intent: ads that trick users into clicking through confusing interface design generate fraudulent clicks that sophisticated networks detect and filter, reducing effective CPM rather than increasing it.
CPA: Cost Per Action
CPA pays only when a user takes a specific post-click action: installing an advertised app, completing a registration, or making a purchase. CPA is the most valuable model from an advertiser's perspective because it guarantees return on each dollar spent. For publishers, CPA campaigns pay significantly more per event ($3 to $12+ per qualifying action) than impression or click-based campaigns.
The challenge with CPA is volume: CPA campaigns only generate revenue when users complete the target action, which requires your game's audience to match the advertiser's target demographic closely enough to drive action rates above the threshold where CPA campaigns remain profitable for advertisers. This is why genre and audience alignment between your game and advertiser category significantly impacts the mix of CPM, CPC, and CPA demand available in your ad inventory.
Understanding all three pricing models and how they interact is foundational to optimizing ad revenue in mobile gaming. Mediation platforms automatically optimize across these models in real time, but developers who understand the underlying mechanics make better decisions about ad placement design, audience targeting, and network selection.
Ad Formats and Their Performance Benchmarks
Rewarded Video Ads
Rewarded video is the most important ad format for mobile gaming ad revenue in 2026. Players voluntarily watch 15 to 30-second video ads in exchange for in-game rewards: extra lives, premium currency, continues, or power-ups. Because players opt in, completion rates exceed 95%. eCPMs for rewarded video in the US iOS reach $11 to $20, making it the highest-revenue ad format per impression.
Beyond direct revenue, rewarded video ads improve the broader game economics: players who engage with rewarded ads show 3.5x higher retention compared to non-engagers, and are 4x more likely to make in-app purchases, making rewarded video a conversion bridge that lifts IAP revenue alongside ad revenue. 9 in 10 players interact with rewarded ads, and 85% report enjoying in-game rewards, making it the most player-positive monetization format available.
Best placement triggers for rewarded video: post-death continue offers, energy recharge shortcuts, hint delivery in puzzle games, daily bonus collection, and battle pass reward amplification. These triggers align the reward value with player intent moments, maximizing both opt-in rate and perceived value.
Interstitial Ads
Interstitial ads are full-screen placements triggered at natural session breaks: level completions, death screens, main menu transitions, and loading screens. They do not require opt-in and generate higher impression volume than rewarded formats. eCPMs range from $4 to $10 in tier-1 markets.
The critical management variable for interstitials is frequency. Industry data consistently shows that interstitials displayed more than once per three minutes increase Day 7 churn by measurable amounts. The standard approach is a minimum 180-second cooldown between interstitial placements, combined with session-depth gating that suppresses interstitials in the first two to three minutes of a new session.
Interstitials perform best in games with short sessions (one to three minutes per session): arcade games, casual puzzle games, and endless runner formats. Games with five-plus minute sessions generate more revenue from banner and rewarded formats than from interstitials.
Banner Ads
Banner ads are persistent display placements typically positioned at the top or bottom of the game UI. They generate the lowest eCPMs ($0.50 to $2 in most markets) but deliver consistent impression volume throughout long sessions. Banner ads work best in games where players maintain a fixed UI view for extended periods: strategy games, simulation games, and idle games.
Banners should never obscure gameplay elements or interactive UI components. Banners placed in positions that compete with gameplay input generate accidental clicks, which are filtered as fraud by sophisticated networks, and player frustration that increases uninstall rates.
Playable Ads
Playable ads allow a 30-second interactive game demo before prompting install. They drive the highest advertiser conversion rates of any format, generating premium eCPMs of $10 to $25 in tier-1 markets. For publishers, serving playable ads requires access to demand partners who run playable campaigns, which typically requires integration with premium demand networks or mediation platforms that aggregate high-CPM demand.
Fill Rate: What It Is and Why It Determines Your Revenue
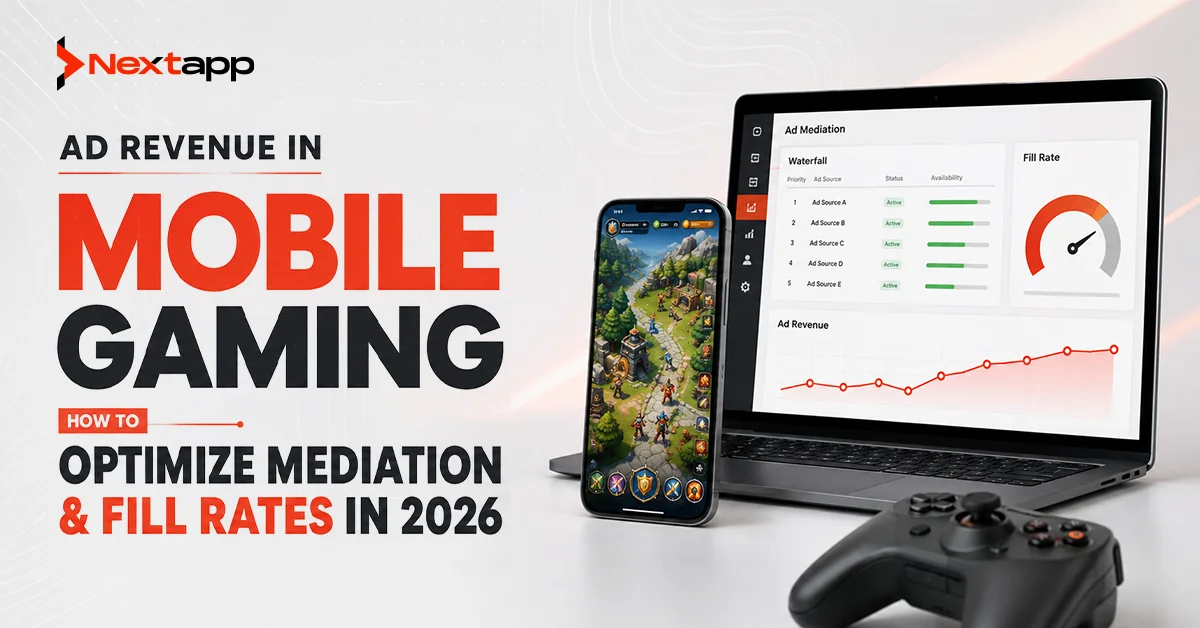
Fill rate is the percentage of ad requests your game sends that are successfully filled with an ad. If your game sends 1,000 ad requests and receives 850 filled ads, your fill rate is 85%.
Fill rate is one of the most overlooked variables in ad revenue in mobile gaming optimization. Even a game with excellent eCPMs generates 15% less ad revenue if its fill rate is 85% rather than 100%. For a game generating 10 million ad requests per month, a 15% fill rate gap equals 1.5 million unfilled impressions. At a $10 average eCPM, that is $15,000 in monthly revenue left on the table.
Low fill rates occur for five reasons. Geographic inventory gaps: some ad networks have weak demand coverage in specific regions, leaving requests from those user segments unfilled. Ad format mismatches: requesting an ad format that a network has limited demand for results in unfilled requests. Network capacity limits: single-network reliance creates fill gaps when that network experiences demand shortfalls. eCPM floor settings that are too high: setting a minimum eCPM floor above market rates in some markets causes networks to decline to fill at those rates. SDK configuration errors: incorrect timeout settings or bidding configurations reduce fill.
All five causes are addressed through mediation, which is covered in the next section. The target fill rate for a professionally mediated mobile game is 95% to 99%.
Ad Mediation: The Engine of Maximum Ad Revenue
Ad mediation is the technology layer that connects your game to multiple ad networks simultaneously and runs real-time auctions to find the highest-paying ad for every impression opportunity. Mediation is the single most impactful technical change any ad-monetized mobile game can make to increase ad revenue in mobile gaming.
Without mediation, a single ad network fills all requests at its prevailing rates with no competition. With mediation, 10 to 20 networks compete for each impression in real time. Competition drives eCPMs up and fill rates up simultaneously.
The four leading mediation platforms in 2026 are AppLovin MAX, IronSource (now part of Unity), Google AdMob Mediation (GFMP), and Chartboost Mediation. Each offers a different balance of demand source access, minimum SDK footprint, analytics depth, and ARPDAU optimization tooling.
AppLovin MAX is the most widely adopted mediation platform for gaming. It provides access to the AppLovin demand ecosystem plus external demand partners, including Meta, Google, Liftoff, and Verizon Media, operating through in-app bidding (real-time simultaneous auctions rather than sequential waterfall). IronSource Mediation provides strong mobile gaming demand access with Unity Ads, IronSource Ads, and external bidders integrated. Google AdMob Mediation provides the broadest geographic coverage for filling global requests across emerging markets. Chartboost Mediation specializes in gaming traffic and provides strong gaming-specific demand quality.
For developers researching full mobile app monetization platforms options, including both ad networks and IAP tools, the platforms guide covers each in depth with integration requirements and 2026 performance benchmarks.
In-App Bidding vs. Waterfall
Traditional ad mediation used a waterfall model: networks were arranged in a priority queue, and each was given a fixed eCPM rate. The first network to fill the impression won, regardless of whether later networks would have paid more. This model left significant revenue on the table.
In-app bidding (IAB) replaced waterfall as the dominant model. All integrated demand sources submit simultaneous sealed-bid auctions for each impression. The highest bid wins. This guarantees every impression sells at its true market rate rather than the first acceptable rate. Studios switching from waterfall to in-app bidding report average eCPM increases of 10 to 30%.
Setting up in-app bidding requires SDK integration for each participating demand partner and a mediation platform capable of running simultaneous auctions (AppLovin MAX and IronSource both support full in-app bidding across their demand networks). The setup investment (typically 2 to 4 weeks of engineering time) pays back in its first month of operation through eCPM uplift.
Ad Revenue Optimization Practices
Eight practices consistently improve ad revenue in mobile gaming without sacrificing retention.
First, implement frequency caps by segment. High-LTV spenders see fewer ads or no interstitials. Non-spenders see the full ad schedule. Segmenting ad exposure by player payment status protects your highest-value players while maximizing revenue from free players.
Second, use geographic eCPM floors. Set minimum eCPM thresholds by region. US and UK requests command $8 to $15 minimums. Southeast Asia and LATAM requests command $1 to $3 minimums. Applying US minimums globally suppresses fill rates in lower-CPM regions unnecessarily.
Third, refresh banner ads every 30 to 60 seconds. Stale banners generate declining attention and click rates. Automatic refresh maintains impression quality.
Fourth, test rewarded video placement triggers continuously. The reward value that maximizes opt-in rate varies by player segment and game progression stage. A/B testing reward types and trigger moments generates measurable ARPDAU improvement over time.
Fifth, track ARPDAU separately for ad-engaging and non-ad-engaging cohorts. Players who engage with rewarded ads generate significantly higher ARPDAU than those who do not. Understanding this difference guides reward design and placement strategy.
Sixth, suppress ads during live events. Player sessions during live events are 30 to 50% longer than normal sessions. Showing fewer interruptions during events improves event completion rates, which increases IAP conversion. The net ARPDAU during events often improves despite lower ad impressions.
Seventh, monitor eCPM trends by day of week. Q4 advertiser budgets cause eCPMs to peak on weekdays and in the first half of each month. Scheduling high-traffic marketing pushes around these periods maximizes the revenue each acquired player generates in their first 30 days.
Eighth, audit SDK version compliance quarterly. Ad network SDKs update continuously. Outdated SDK versions lose access to new demand features, bidding optimizations, and privacy compliance certifications that major advertisers require before serving premium campaigns.
These practices connect directly to mobile game monetization statistics benchmarks and mobile game monetization trends that the industry uses to evaluate ad revenue performance. The developers who track these metrics systematically are the ones consistently outperforming genre ARPDAU averages.
Connecting Ad Revenue to the Full Monetization Strategy
Ad revenue does not operate in isolation. It functions as part of a broader mobile game monetization system where ad income, IAP conversion, and subscription revenue reinforce each other when designed correctly.
For studios building their first title, this starts at concept: choosing the right mobile game monetization models for your genre, understanding the most profitable mobile game monetization strategy options available, and designing ad placement triggers into the core loop from the first production build rather than integrating ads into a finished game. See the guides on what is game development and game development stages for how monetization design fits into the broader production pipeline.
For studios looking to increase revenue from existing titles, evaluating mobile game monetization alternatives without ads alongside ad optimization creates the strategic context to decide whether pure IAP, subscription, or hybrid models would generate more total ARPDAU than the current ad-heavy approach.
And for developers who want to understand the full player-facing economics before building, studying game apps that pay real money and how to make money playing video games as a player gives direct insight into which monetization systems players find valuable versus exploitative.
Conclusion
Ad revenue in mobile gaming is a precision discipline. The studios that maximize it understand not just which ad formats to use, but where to place them, how frequently to serve them, which pricing models generate the highest eCPM for their audience, and how to use mediation to ensure every impression sells at its true market rate.
The path to higher ARPDAU from advertising runs through three parallel workstreams: format optimization (rewarded video first, interstitials at natural breaks, banners in long sessions), mediation setup (in-app bidding across 10 to 20 demand sources), and frequency management (maximizing impressions without crossing the retention threshold). All three must run simultaneously, measured continuously against ARPDAU rather than raw impression volume.
For developers starting a new game, connecting ad revenue in mobile gaming strategy to full production planning, from how to make a game app from scratch through mobile game development cost budgeting and post-launch mobile game monetization execution, is what separates games that sustain and grow from games that stall after launch.
NextApp Inc. delivers full-cycle mobile game development services including monetization architecture, ad SDK integration, mediation configuration, and live-ops revenue optimization. Contact our mobile game development company team to build or scale your ad revenue system today.
Frequently Asked Questions (FAQs)
What is the average eCPM for mobile games in 2026?
US iOS rewarded video averages $11 to $20 eCPM. US Android rewarded video averages $8 to $16. Global averages range from $3.31 to $19.63 depending on geography and format. Interstitials average $4 to $10 in tier-1 markets. Banners average $0.50 to $2 globally.
What is fill rate and how do I improve it?
Fill rate is the percentage of ad requests that are successfully served with an ad. Improve fill rate by implementing mediation (connecting to multiple demand sources), using in-app bidding instead of waterfall, setting regional eCPM floors rather than global floors, and keeping SDK versions current.
What is the difference between CPM, CPC, and CPA?
CPM pays per 1,000 impressions. CPC pays per user click. CPA pays per completed action (install, registration, purchase). Publishers use eCPM as the universal efficiency metric that normalizes all three models to revenue per 1,000 impressions for fair comparison.
Which ad format makes the most money for mobile games?
Rewarded video generates the highest eCPMs ($8 to $20 in tier-1 markets), the highest player satisfaction rates, and cross-benefits for IAP conversion. It is the primary revenue driver for hybrid-monetized games at every scale.
How many ads should I show per session?
Maximum one interstitial per three minutes of gameplay, with no interstitial in the first two minutes of a session. Rewarded video should be available on demand but never forced. Banner ads can persist throughout a session with 30 to 60-second refresh cycles. Monitor Day 7 retention alongside ARPDAU to find your specific game's optimal frequency ceiling.
Should I use ad revenue or IAP as my primary model?
Genre determines the optimal primary model. Hyper-casual and casual games with large non-paying audiences prioritize ad revenue. Mid-core and RPG games prioritize IAP with rewarded ads as supplemental. For a complete model selection framework, see the guide on mobile game monetization models and evaluate against your specific genre ARPDAU benchmarks.
How do I get started with advertising my game to grow the player base that generates ad revenue?
Start with ASO and organic channels, then layer in paid acquisition once retention metrics are validated. For the full advertising strategy framework, see the guide on how to advertise your mobile games which covers ASO, paid UA, influencer partnerships, and community building in full.